Multiple Regression and Correlation Analysis
Introduction
In chapter 13 we described the relationship between a pair of interval- or ratio-scaled variables. We began the chapter by studying the coefficient of correlation, which measures the strength of the relationship. A coefficient near plus or minus 1.00 (-.088 or -0.78, for example) indicates a very strong linear relationship, whereas a value near 0 (-.012 or .18, for example) means that the relationship is weak. Next we developed a procedure to determine a liner equation to express the relationship between the two variables. We referred to this as a regression line. This line describes the relationship between the variables. It also describes the overall pattern of a dependent variables() to a single independent or explanatory variable().
In multiple linear correlation and regression we use additional independent variables (denoted ,...,and so on) that help us better explain or predict the dependent variable (). Almost all of the ideas we saw in simple linear correlation and regression extend to this more general situation. However, the additional independent variables do lead to some new considerations. Multiple regression analysis can be used either as a descriptive or as an inferential technique.
Multiple Regression Analysis
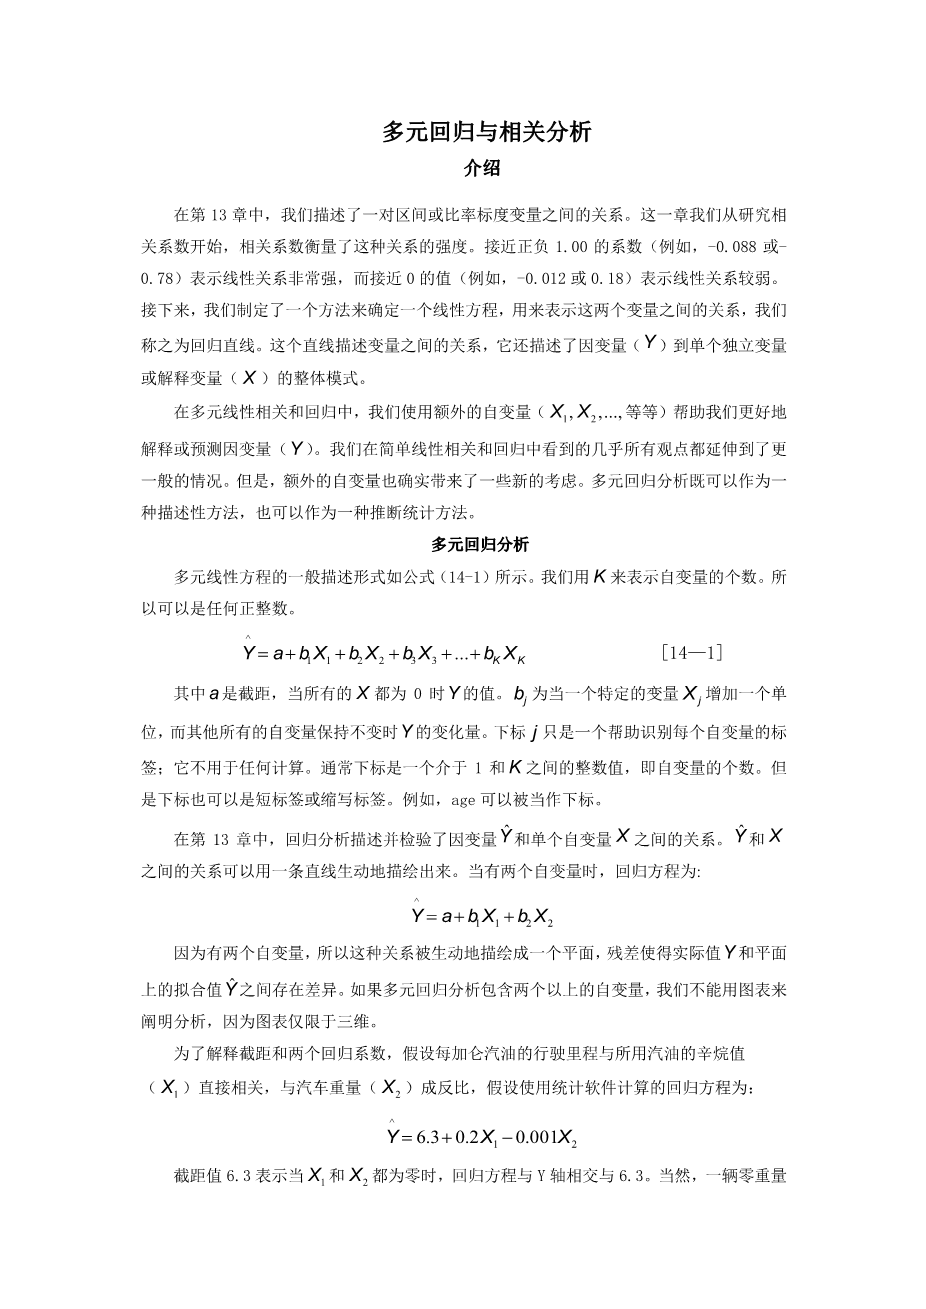
The general descriptive form a multiple linear equation is shown in formula(14-1). We use to represent the number of independent variables. So can be any positive integer.
[14—1]
Where is the intercept ,the value of when all the are zero. is the amount by which changes when that particular increase by one unit, with the values of all other independent variables held constant. The subscript is simply a label that helps to identify each independent variable; it is not used in any calculations. Usually the subscript is an integer value between 1 and , which is the number of independent variables. However, the subscript can also be a short or abbreviated label. For example, age could be used as a subscript.
In Chapter 13, the regression analysis described and tested the relationship between a dependent variable,,and a single independent variable,. The relationship between and was graphically portrayed by a line. When there are two independent variables, the regression equation is
Because there are two independent variables, this relationship is graphically portrayed as a plane .The residuals made the difference between the actual and the fitted on the plane. If a multiple regression analysis include more than two independent variables, we cannot use a graph to illustrate the analysis since graph are limited to three dimension.
To illustrate the interpretation of the intercept and the two regression coefficients,
Suppose a vehicles mileage per gallon of gasoline is directly related to the octane rating of the gasoline being used () and inversely related to the weight of the automobile () Assume that the regression equation, calculated using statistical software, is:
The intercept value of 6.3 indicates the regression equation intersects the Y-axis at 6.3 when both and are zero. Of course, this does not make any physical sense to own an automobile that has no (zero) weight and to use gasoline with no octane. It is important to keep in mind that a regression the range of the sample values.
The of 0.2 indicates that for each increase of 1 in the octane rating of the gasoline, the automobile would travel 2/10 of a mile more per gallon, regardless of the weight of the vehicles weight. The value of -0.001 reveals that for each increase of one pound in the vehicles weight, the number of miles traveled per gallon decreases by 0.001,regardless of the octane of the gasoline being used.
As an example, an automobile with 92-octane gasoline in the tank and weighing 2,000 pounds would travel an average 22.7 miles per gallon, found by:
The values for the coefficients in the multiple linear equation are found by using the method of least squares. Recall from the previous chapter that the least squares method makes the sum of the squared differences between the fitted and actual values of as small as possible. The calculation are very tedious, so they are usually performed by a statistical software package, such as Excel or MINITAB.
How Well Does the Equation Fit the Data?
Once you have the multiple regression equation, it is natural to ask 'how well does the equation fit the data?' In linear regression, discussed in the previous chapter, you used summary statistics such as the standard error of estimate and the coefficient of determination to describe how effectively a single independent variable. The same procedure, broadened to additional independent variables, are used in multiple regression.
Multiple Standard Error of Estimate
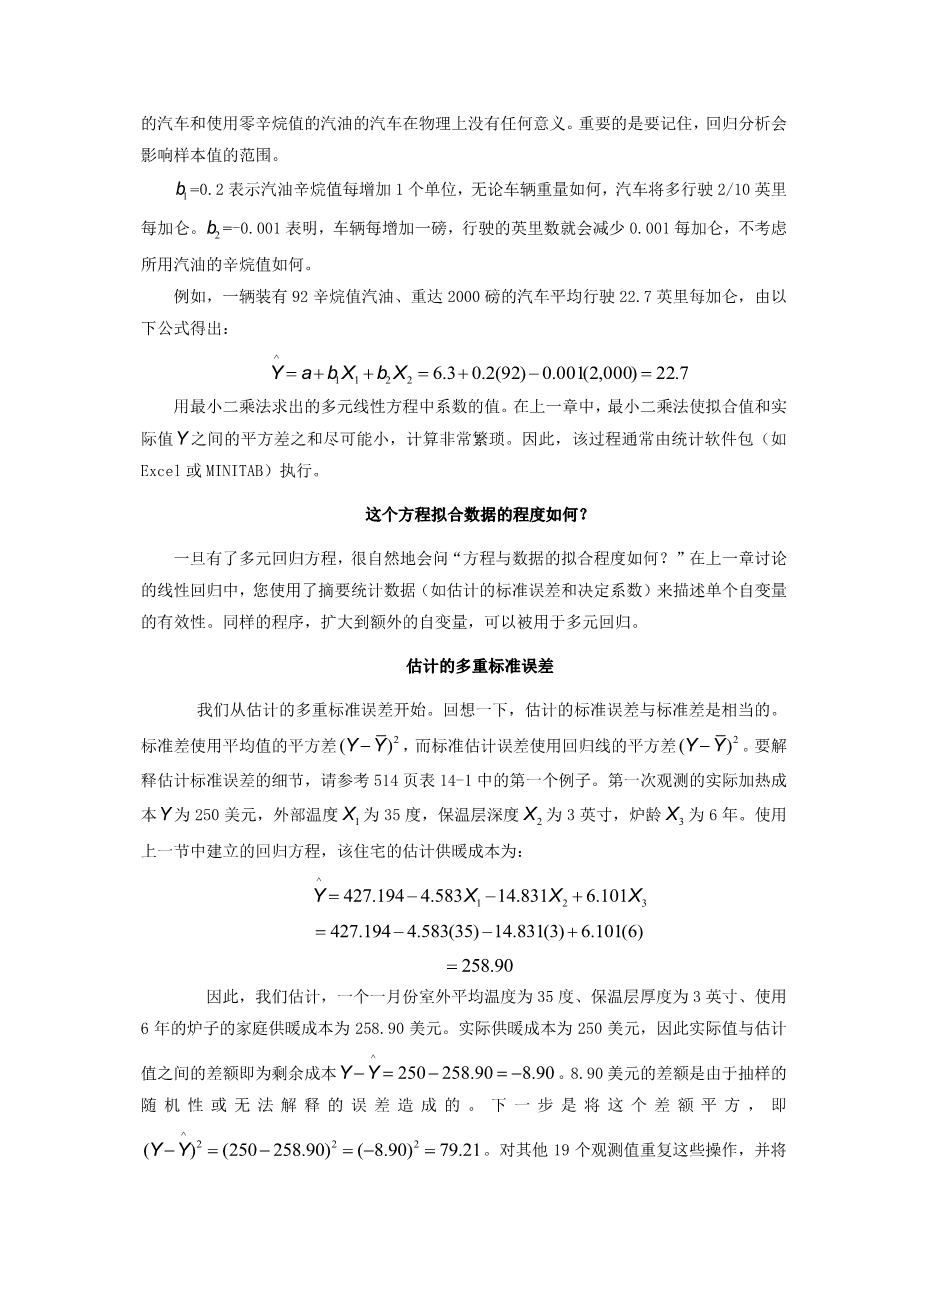
We begin with the multiple standard error of estimate. Recall that the standard error of estimate is comparable to the standard deviation. The standard deviation uses squared deviations from the mean, , whereas the standard error of estimate utilizes squared deviations from the regression line, . To explain the details of the standard error of estimate, refer to the first sampled home in Table 14-1 in the previous example on page 514. The actual heating cost for the first observation, , is $250, the outside temperature, , is 35 degrees, the depth of insulation, , is 3 inches, and the age of the furnace,, is 6 years. Using the regression equation developed in the previous section, the estimated heating cost for this home is:
=258.90
So we would estimate that a home with a mean January outside temperature of 35 degree, 3 inche
剩余内容已隐藏,支付完成后下载完整资料


英语译文共 5 页,剩余内容已隐藏,支付完成后下载完整资料
资料编号:[404905],资料为PDF文档或Word文档,PDF文档可免费转换为Word


