英语原文共 10 页,剩余内容已隐藏,支付完成后下载完整资料
Combination of Distances and Image Features for Clustering Image Data Bases
Sarah Frost and Daniel Baier
结合距离和图像特征来聚类图像数据库
莎拉·弗罗斯特和丹尼尔·贝尔。
Abstract Daily, millions of pictures are released online but it is hard to analyze them automatically for marketing purposes. This paper tries to show how methods from the content-based image retrieval could be used to classify image data and make them usable for marketing applications. There are a number of different image features which can be extracted from the images to calculate dissimilarities between them afterwards with different kinds of distance measures (Manjunathet al. 2001). We focus especially on mass-transportation-problems, like the EarthMoverrsquo;s Distance (EMD) (Rubner et al., Int J Comput Vis 40(2):99–121, 2000),because they fit the human perception on dissimilarities.
Furthermore there are already some studies that show that they are robust to disturbances like changes in resolution, contrast, or noise (Frost and Baier, Algorithms from and for nature
and life. Studies in classification, data analysis, and knowledge organization, vol 45. Springer, Heidelberg, 2013). We compare some approximations of the EMD (e.g., Pele and Werman 2009) with an approximation algorithm developed by ourselves. The aim is to find a combination of features and distances which allows to cluster large image data bases in a way that fits the human perception.
摘要
每天都有数百万张图片在网上发布,但自动很难分析它们来达到营销目的。本文试图说明如何利用基于内容的图像检索方法对图像数据进行分类,并使其用于营销。有许多不同的图像特征可以从图像中提取出来,以用不同的距离度量来计算它们之间的不同。我们特别关注大规模移动问题,像搬土距离(EMD),因为他们几乎符合人类感知。目前已经有一些研究表明,它们对诸如分辨率、对比度或噪声等变化的干扰是很强烈的。我们比较了EMD的近似值和我们自己开发的近似算法。其目的是寻找一种功能和距离的结合,使庞大的图像数据基能够以符合人类感知的方式聚集在一起。
1 Introduction
One can use image clustering, for example, for customer segmentation. Instead of asking for activities, interests, and opinions one can use uploaded pictures from these topics (e.g., holiday pictures), because customers with similar images may also have similar interests or activities. Or one can combine questionnaires and images to find out which type of people takes which types of photos. Another application of the calculated similarity of images is to position brands via their poster advertisings. This method could help to erase confusion of brands or to reposition brands with new campaigns.
1介绍
有的事物会使用到图像聚类,例如,客户细分。探求其活动、兴趣和意见,还可以使用这些主题的已上传图片,因为拥有相似图片的客户可能也有类似的兴趣或活动。或者,你可以把调查问卷和图片结合起来,找出哪种类型的人会选择哪种类型的照片。另一种相似性计算的应用是通过海报广告来定位品牌。这种方法可以有助于消除品牌的混淆,或用新活动重新定位品牌。
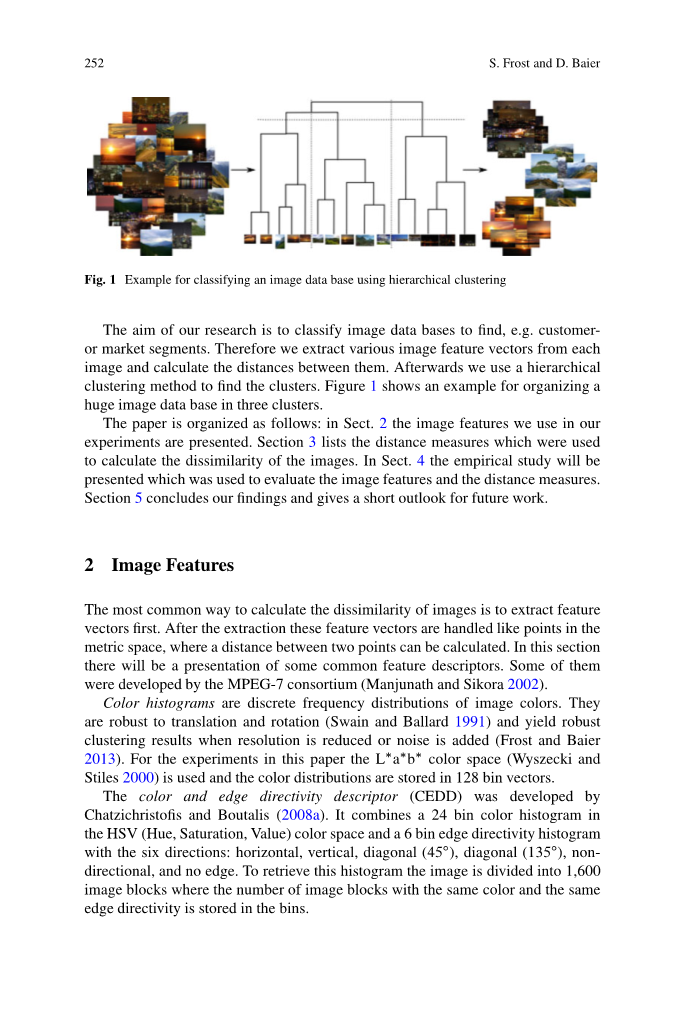
The aim of our research is to classify image data bases to find, e.g. customer or market segments. Therefore we extract various image feature vectors from each image and calculate the distances between them. Afterwards we use a hierarchical clustering method to find the clusters. Figure 1 shows an example for organizing a huge image data base in three clusters.
The paper is organized as follows: in Sect. 2 the image features we use in our experiments are presented. Section 3 lists the distance measures which were used to calculate the dissimilarity of the images. In Sect. 4 the empirical study will be presented which was used to evaluate the image features and the distance measures. Section 5 concludes our findings and gives a short outlook for future work.
我们的研究目的是将图像数据的基础分类,例如客户或细分市场。因此,我们从每个图像中提取不同的图像特征向量,并计算它们之间的距离。然后,我们使用层次聚类方法来查找集群。图1显示了在三个集群中组织一个巨大的图像数据库的示例。
本文内容如下:第2节介绍了我们在实验中使用的图像特征。第3节列出了用于计算图像不同的距离度量。在第4节中,我们将提出实证研究来评价图像特征和距离度量。第五部分总结了我们的研究成果,并对未来的工作做了展望。
2 Image Features
The most common way to calculate the dissimilarity of images is to extract feature vectors first. After the extraction these feature vectors are handled like points in the metric space, where a distance between two points can be calculated. In this section there will be a presentation of some common feature descriptors. Some of them were developed by the MPEG-7 consortium (Manjunath and Sikora 2002).
计算图像不同的最常用的方法是先提取特征向量。提取后,这些特征向量就像度量空间中的点一样处理。,这两个点之间的距离可以计算。在本节中,将介绍一些常用的特征描述符。其中一些是由MPEG-7财团开发的。
Color histograms are discrete frequency distributions of image colors. They are robust to translation and rotation (Swain and Ballard 1991) and yield robust clustering results when resolution is reduced or noise is added (Frost and Baier 2013). For the experiments in this paper the L*a*b color space (Wyszecki and Stiles 2000) is used and the color distributions are stored in 128 bin vectors.
颜色直方图是图像颜色的离散频率分布。它们的翻转和旋转(Swain和Ballard 1991)都很强大,以及当分辨率降低或噪声增加(Frost and Baier 2013)时,会产生强大的聚类结果。
对于本文的实验,L*a*b色空间(Wyszecki 和Stiles 2000)被使用和颜色分布存储在128个二进制向量中。
The color and edge directivity descriptor (CEDD) was developed by Chatzichristofis and Boutalis (2008a).
It combines a 24 bin color histogram in the HSV (Hue, Saturation, Value) color space and a 6 bin edge directivity histogram with the six directions: horizontal, vertical, diagonal (45ı), diagonal (135ı), nondirectional, and no edge.
To retrieve this histogram the image is divided into 1,600 image blocks where the number of image blocks with the same color and the same edge directivity is stored in the bins.
颜色和边缘方向描述符(CEDD)是由Chatzichristofis和Boutalis (2008a)开发的。它结合了一个24个二进制颜色直方图在HSV (色相,饱和度,价值)颜色空间和一个6个二进制边缘方向直方图伴随六个方向:水平、垂直、对角线(45ı)对角线(135ı),没有方向的,无边。
为了检索这个直方图,图像被分割为1600个图像块,其中很多具有相同的颜色和相同的边缘指示性图像块存储在箱子中。
The fuzzy edge and texture histogram (FCTH) is similar to the CEDD but instead of edge directivities there are eight types of textures used to combine color and structure of an image (Chatzichristofis and Boutalis 2008b). The assignment to a bin of the FCTH follows a fuzzy logic. That means that an image block can be 40 % black and 60 % gray. Because of very good image data base clustering results in some pretests we developed a ground distance for CEDD and FCTH, which is the distance between two bins of the histogram (see Sect. 3).lt;
全文共20372字,剩余内容已隐藏,支付完成后下载完整资料
资料编号:[10865],资料为PDF文档或Word文档,PDF文档可免费转换为Word

